war_visulization_moran_I

1
2
#import the moran's I package:
library(ape)

Data source

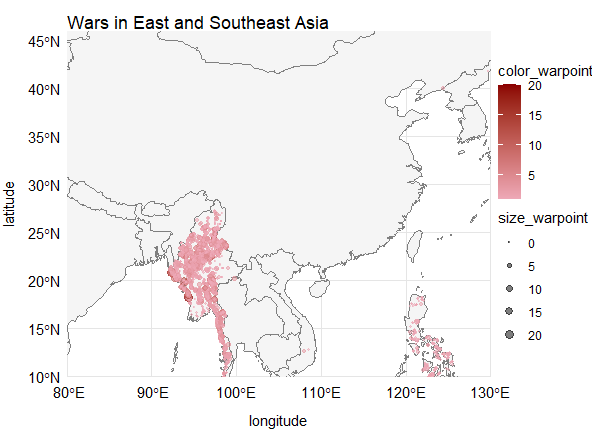
The conflict events are sourced from the ‘Armed Conflict Location & Event Data Project’ (ACLED) which records the latitude and longitude, time, actors, and casualty numbers of violent events [4]. We selected the ‘battle’ type of conflict event data from the ACLED database. From January 1, 2023, to October 1, 2024, the ACLED database recorded a total of 7,719 relevant war events in East Asia and Southeast Asia.

import the data

1
2
3
getwd()#you can use it to find the folder 
setwd("D:/R-4.3.1/R.SCRIPT/THE COURSE/VISUALIZATION/assignment-10.24/R-code and data")#you can change the file directory.
war_in_asia<-read.csv("2023-01-01-2024-10-01-East_Asia-Southeast_Asia.csv")
1
wardata<-data.frame(war_in_asia$fatalities,war_in_asia$latitude,war_in_asia$longitude)
1
length(war_in_asia$region[war_in_asia$region=='Southeast Asia'])
1
mean(war_in_asia$fatalities)
1
median(war_in_asia$fatalities)
1
wardata <- na.omit(wardata)

visualization of the wars

1
2
3
4
5
6
7
8
9
10
11
12
13
14
15
16
17
18
19
20
21
22
23
24
25
26
27
28
29
30
31
32
33
34
35
36
37
38
39
40
41
42
43
44

longitude <- wardata$war_in_asia.longitude
latitude <- wardata$war_in_asia.latitude

library(ggplot2)
library(ggmap)
library(sp)
library(rnaturalearth)

# load the world data
world <- ne_countries(scale = "medium", returnclass = "sf")

# set the world map
mp <- ggplot() +
geom_sf(data = world, fill = "gray96", color = "gray50") +
coord_sf(crs = "+proj=longlat +datum=WGS84") +
theme_void()

# put the point where wars happened
size_warpoint <- wardata$war_in_asia.fatalities**(1/2)
color_warpoint <- (wardata$war_in_asia.fatalities + 1)**(1/2)

mp2 <- mp +
geom_point(aes(x = longitude , y = latitude, size = size_warpoint,
color = color_warpoint), alpha = 0.5) +
scale_color_gradient(low = "pink2", high = "darkred") +
scale_size(range = c(0.1, 3))

# focus on the research district
mp3 <- mp2 +
geom_sf() +
coord_sf(xlim = c(80, 130), ylim = c(10, 46), expand = FALSE) +
labs(title = "Wars in East and Southeast Asia") +
theme(
axis.title.x = element_text(margin = margin(t = 10)),
axis.title.y = element_text(angle = 90,margin = margin(r = 10)),
axis.text.x = element_text(margin = margin(t = 5)),
axis.text.y = element_text(margin = margin(r = 5)),
panel.grid.major = element_line(color = "gray90", linewidth = 0.5),
panel.grid.minor = element_line(color = "gray95", linewidth = 0.25)
)

# show the map
mp3

moran’s I index

This study aims to investigate whether the intensity of wars in the East Asia-Southeast Asia region is related to spatial factors:

1
2
3
4
5
6
7
8
9
warplace.dists <- as.matrix(dist(cbind(wardata$war_in_asia.latitude, wardata$war_in_asia.longitude)))

warplace.dists.inv <- 1/warplace.dists

diag(warplace.dists.inv) <- 0
warplace.dists.inv[is.infinite(warplace.dists.inv)] <- 0
MoranItest_result<-Moran.I(wardata$war_in_asia.fatalities,warplace.dists.inv)

MoranItest_result
1
2
write.csv(MoranItest_result, "moranIoutput.csv", row.names = TRUE)


war_visulization_moran_I
http://example.com/2024/10/24/war_visuliztion/
Author
zhuoyu
Posted on
October 24, 2024
Licensed under