mesa-geo introduction(1)
war spread model(内战传播模型):
A simplified ABM (Agent-Based Model) describing spatial dependency and spatial heterogeneity:
- Spatial dependency: This refers to the phenomenon that an area is more likely to experience civil war if its surrounding areas are experiencing civil war.
- Spatial heterogeneity: Based on existing research, we define spatial heterogeneity as the proximity to the capital. Areas closer to the capital are more prone to war, as the upper echelons of the country often initiate wars and the central government is typically located in the capital.
Here, to let you get the correct data type conveniently,this blog still use the official geo-data. You can try to get the TorontoNeighbourhoods.geojson from the official website, and have a try:
https://github.com/projectmesa/mesa-examples/blob/main/gis/geo_sir/data/TorontoNeighbourhoods.geojson
import package
1 | |
create regionAgent
1 | |
model part: combine agents, time and space
1 | |
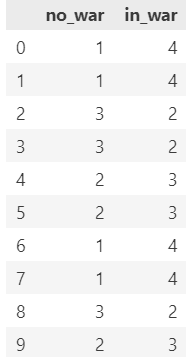
run war spread model
1 | |
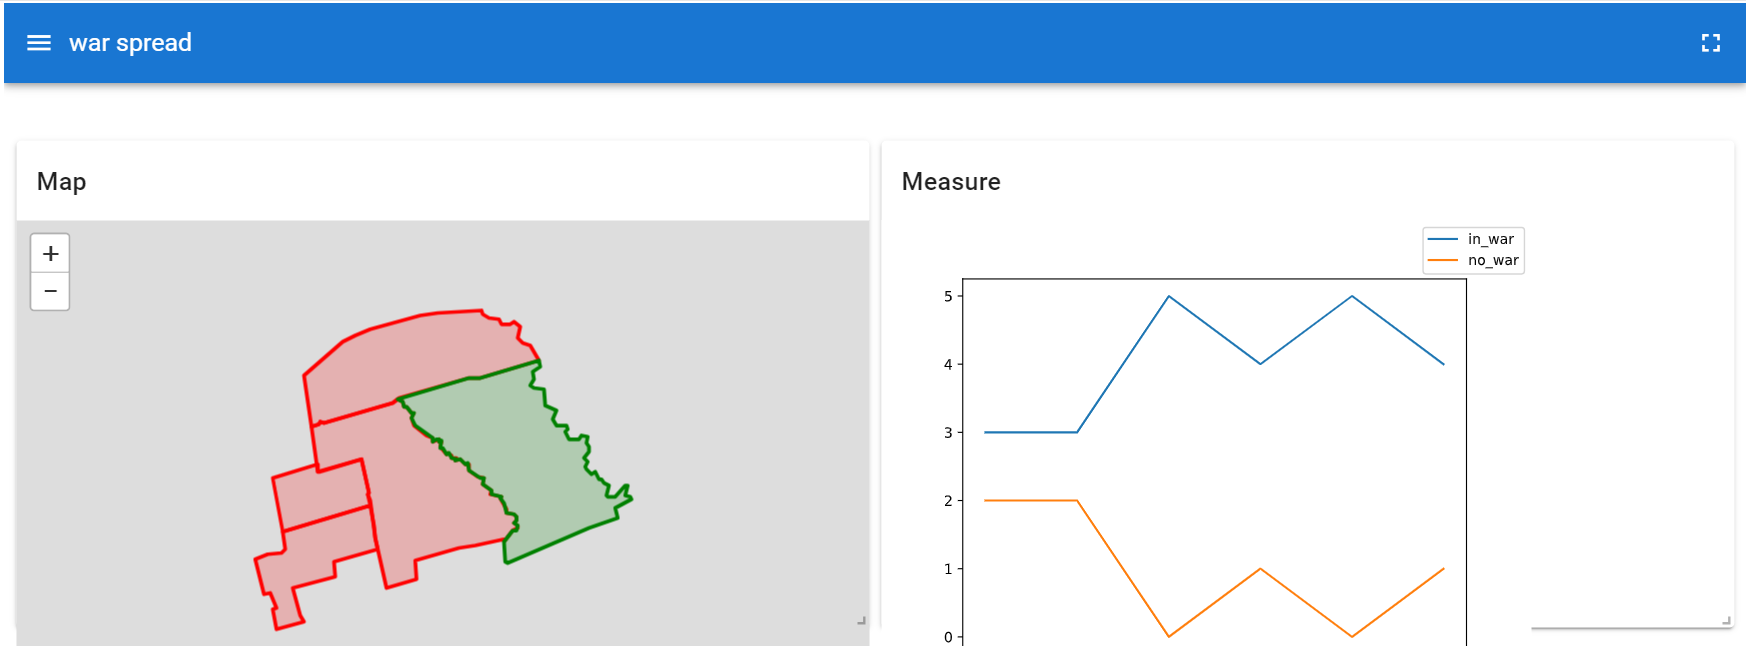
model visulization
1 | |
1 | |
visualization in the Jupyter notebook
1 | |
reference
Chen Chong, Hu Jingtian. Spatial Dependence and the Prediction of Armed Conflicts [J]. International Political Science, 2022, 7(2): 86-123.
https://cc458.github.io/files/chen_hu_2022qjip.pdf
mesa-geo introduction(1)
http://example.com/2024/11/12/war-abm-mesageo/